Kate Tanha is a student at Minerva Schools majoring in Computer Science, with an interest in politics and psychology. The data shared in the post below is a result of analyses conducted by Kate using Wolfram, an application for computational programming.
In the summer of 2019, I spent four weeks at Project Zero working with the Out of Eden Learn team. Deeply interested in discovering and sharing stories in data, I was excited by the potential to investigate the impact of a design-based research study like Out of Eden Learn (OOEL). To date, OOEL researchers have conducted qualitative analyses of the data (student posts, comments, etc.) on the platform. While nuanced findings are more likely to emerge when using qualitative approaches, quantitative analysis can yield interesting insights from particularly large data sets. For example, a large data set might be the over 115,000 posts and more than 260,000 comments on the OOEL platform. As an OOEL Research Assistant, I set out to unearth what was buried in this trove of data. When conducted responsibly with nuanced interpretations, big data can help uncover stories we might not otherwise have seen, illuminating the diversity of the OOEL community.
To date, over 30,000 students have participated in Out of Eden Learn’s free online learning platform from 60 different countries (Figure 1) and 399 different cities (Figure 3) around the world. In the United States (US) alone, the platform has reached 44 different states. About 60 percent of the students on the platform are from the US, which is not surprising considering that OOEL is based in the United States. One of the first insights during my research was: once we look at city-level data, the most commonly represented city is—surprisingly—not in the US or North America, but is instead Serpong, Indonesia, as shown below in Figure 3. In the following word clouds, the size of each entity—country or city—depends on its frequency i.e. the number of students registered to participate in Out of Eden Learn in each country/city.

Figure 1. Countries represented in the Out of Eden Learn platform, where the size of each country is scaled by the number of students participating in that country.
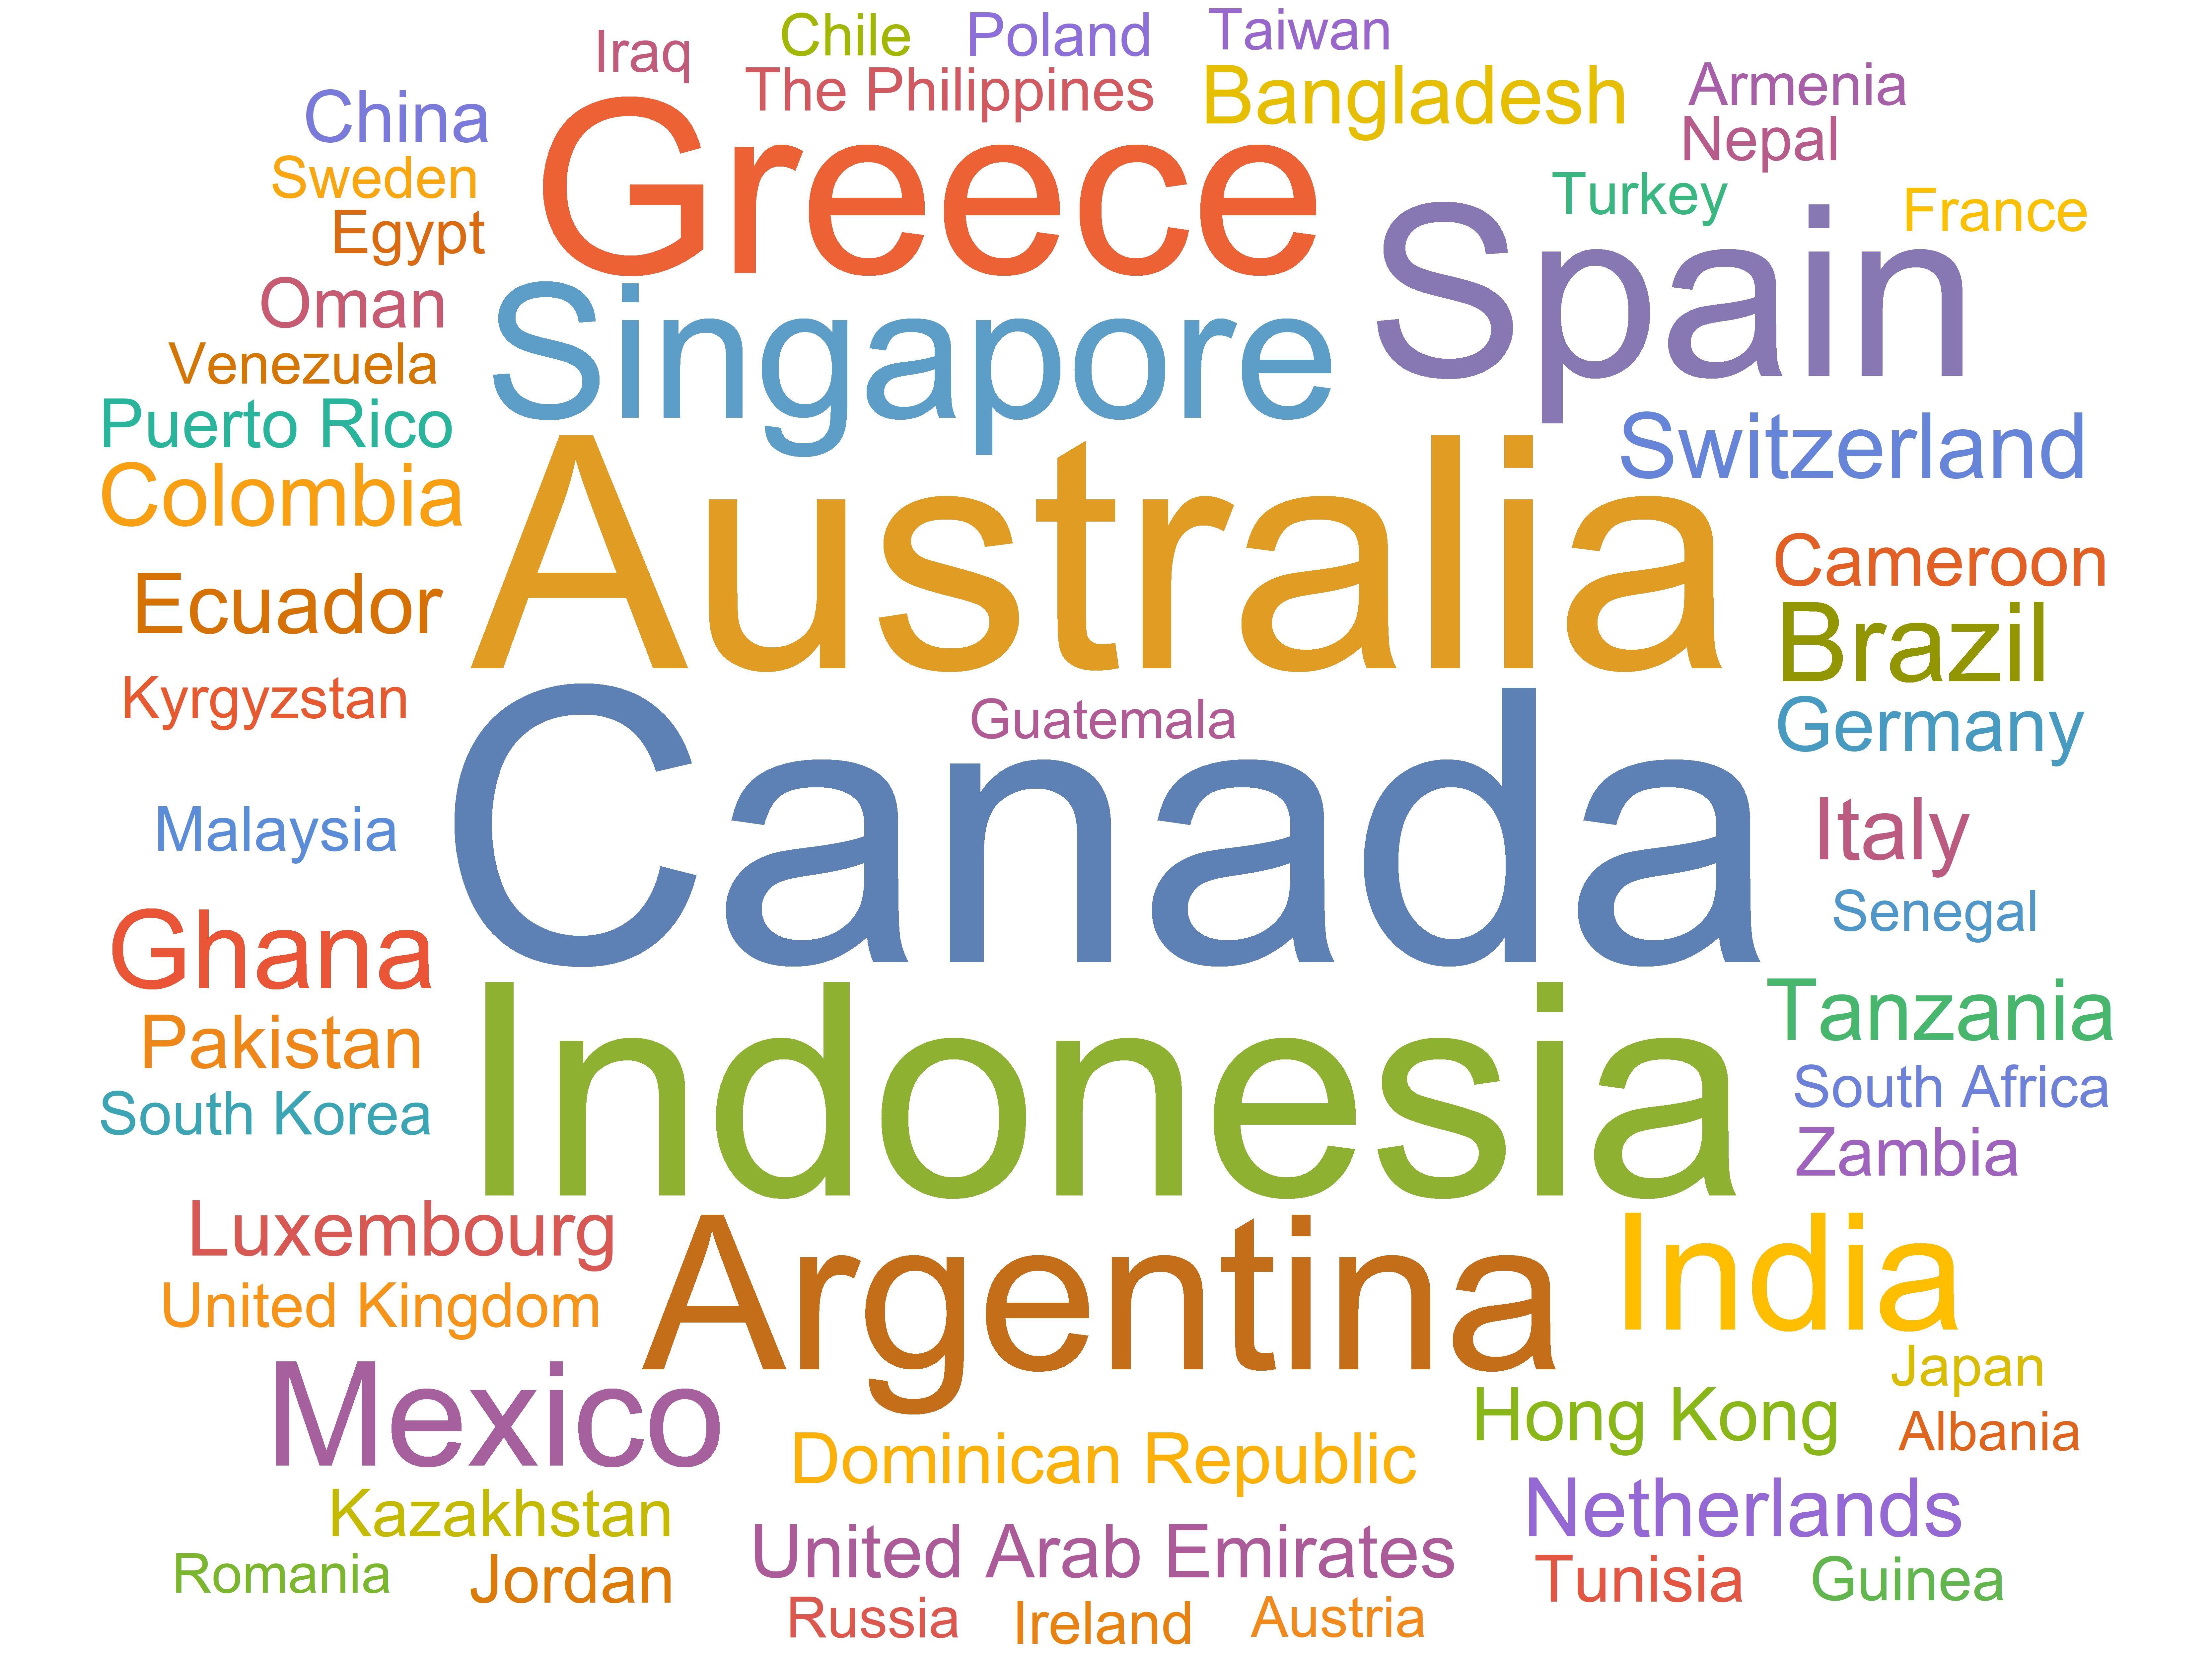
Figure 2. Countries represented in the Out of Eden Learn platform (excluding the United States), where the size of each country is scaled by the number of students participating in that country.
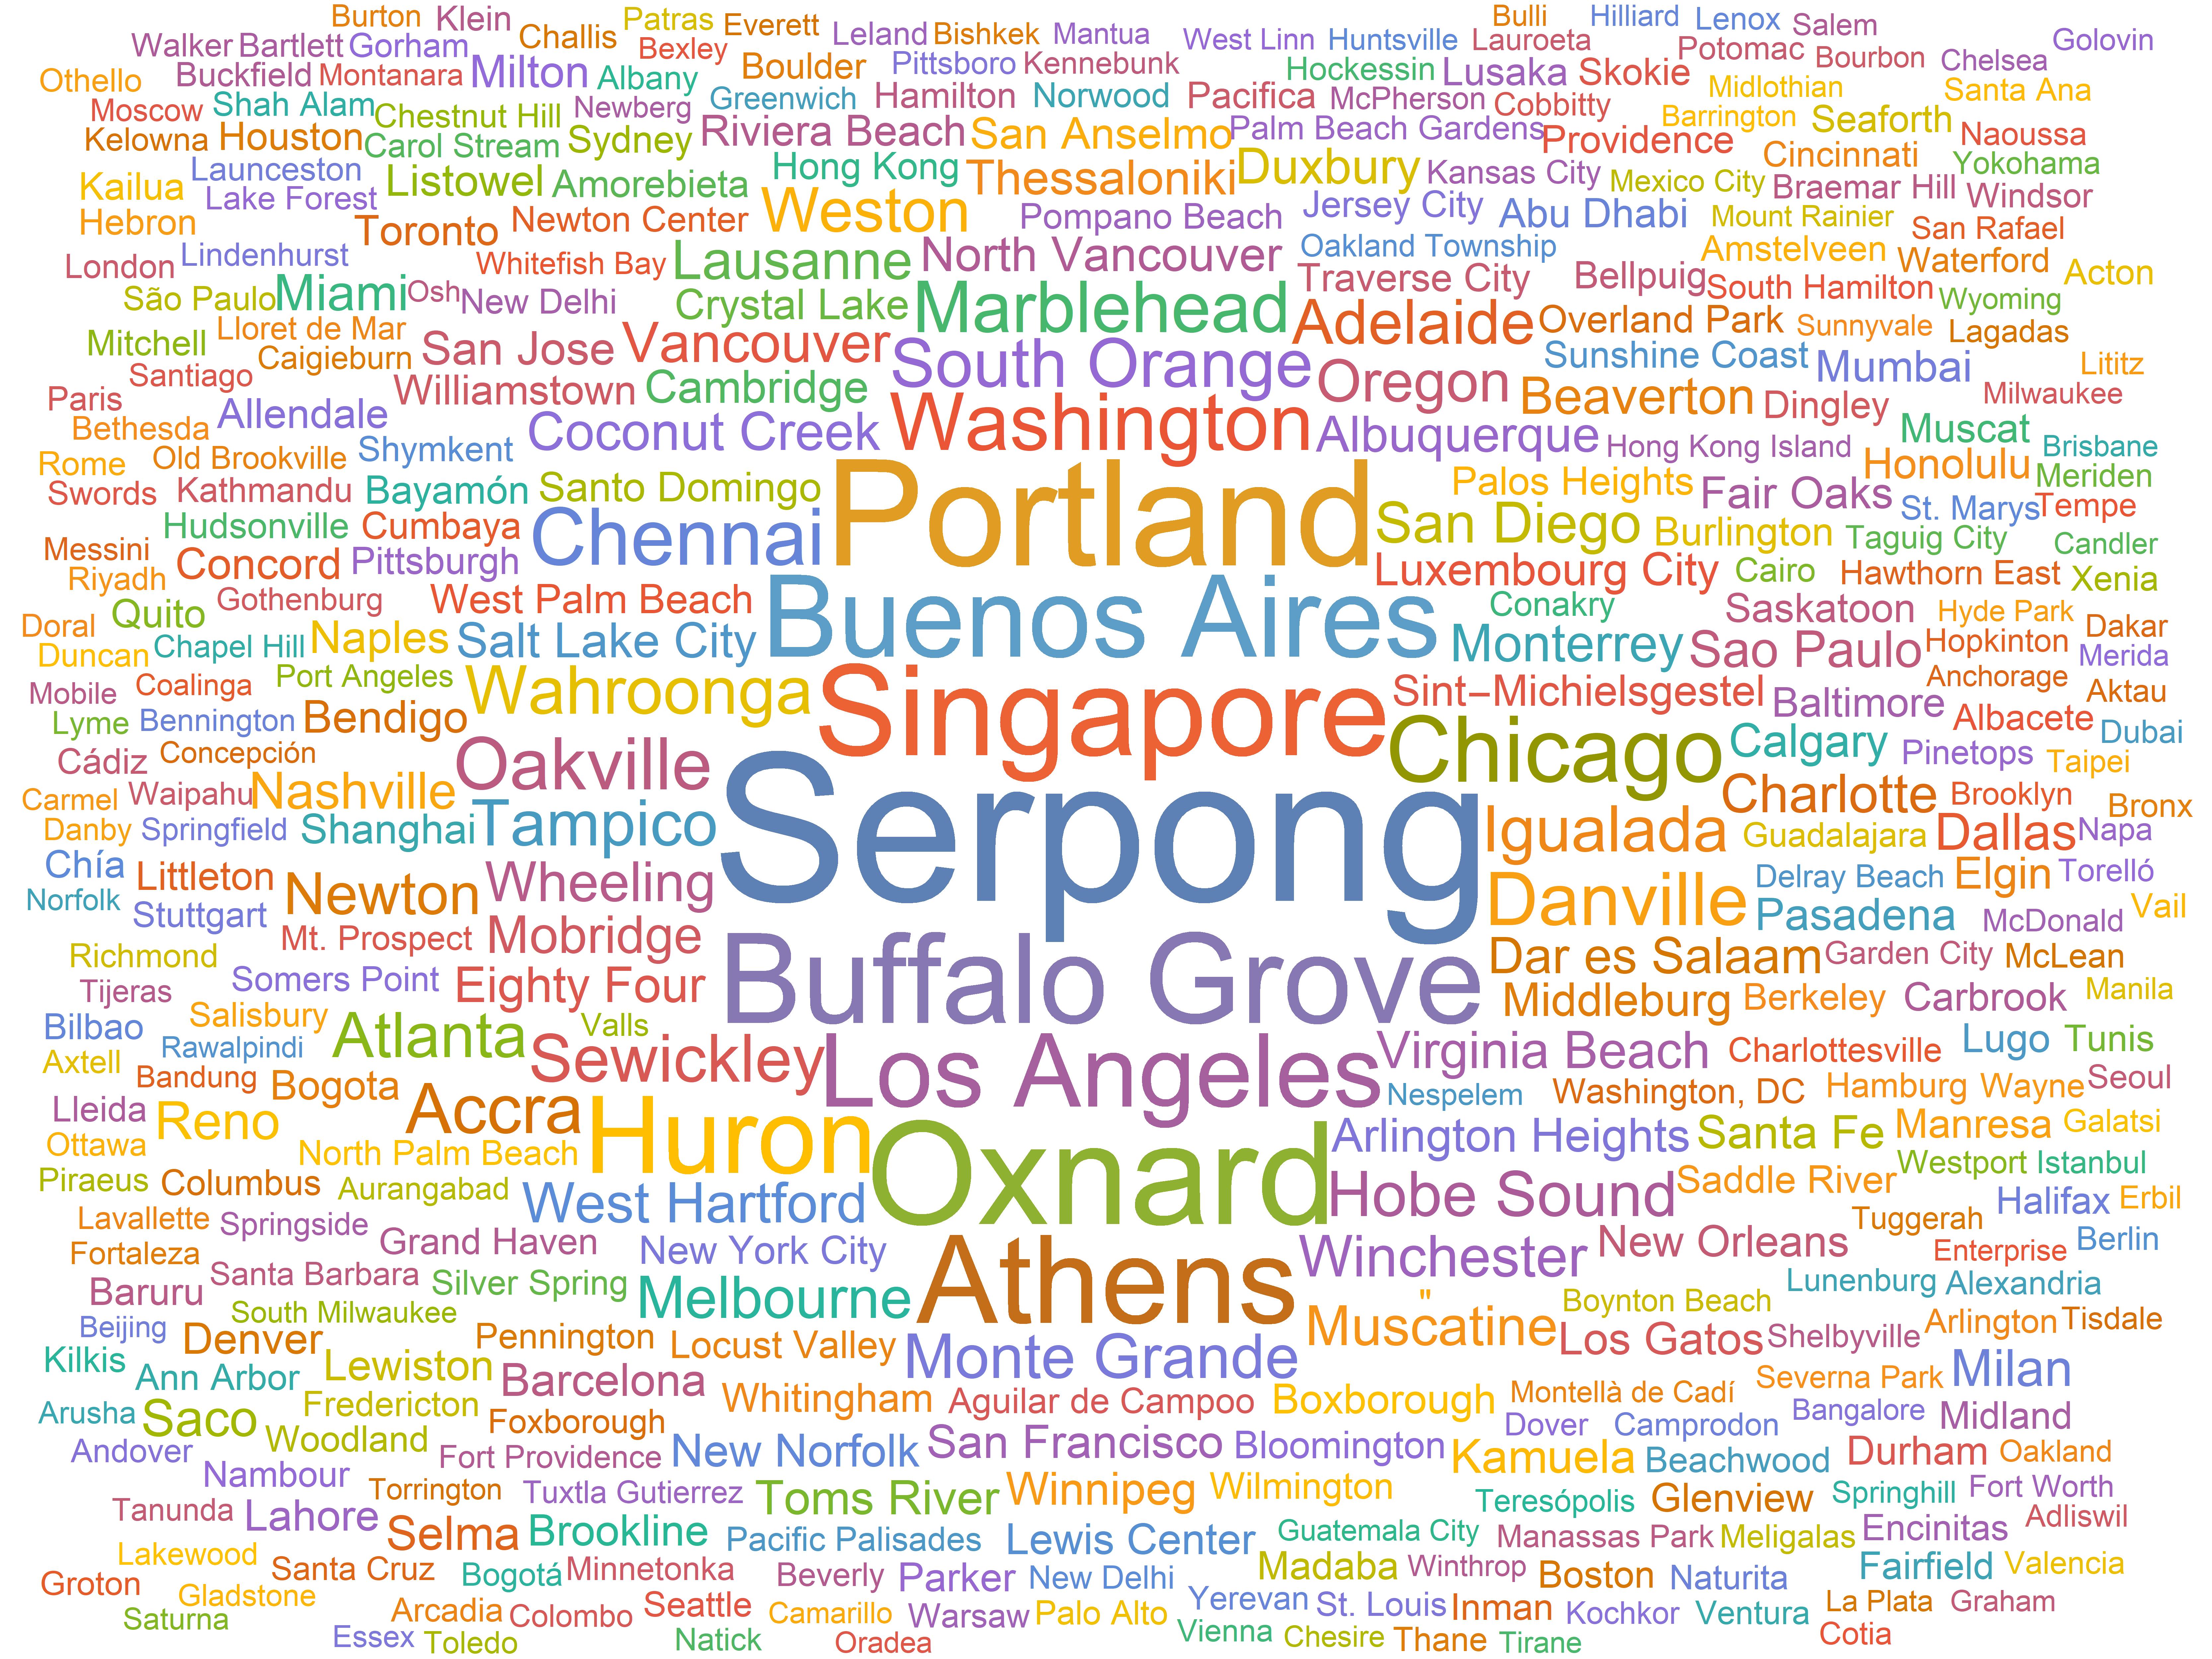
Figure 3. The 399 cities represented in the Out of Eden Learn platform, where the size of each city is scaled by the number of students participating in that city.
Undoubtedly, the OOEL platform represents a diverse cohort of students from all around the world, a claim further supported once we look at the languages students report they speak at home. To date, we have students that speak 144 different languages on the platform (Figure 4). This incredible diversity of languages include: Tongan (an Austronesian language spoken in the Polynesian country, Tonga), Wolof (the Niger-Congo language of the Wolof) and Basque (a language spoken in the Basque Country with 750,000 native speakers).
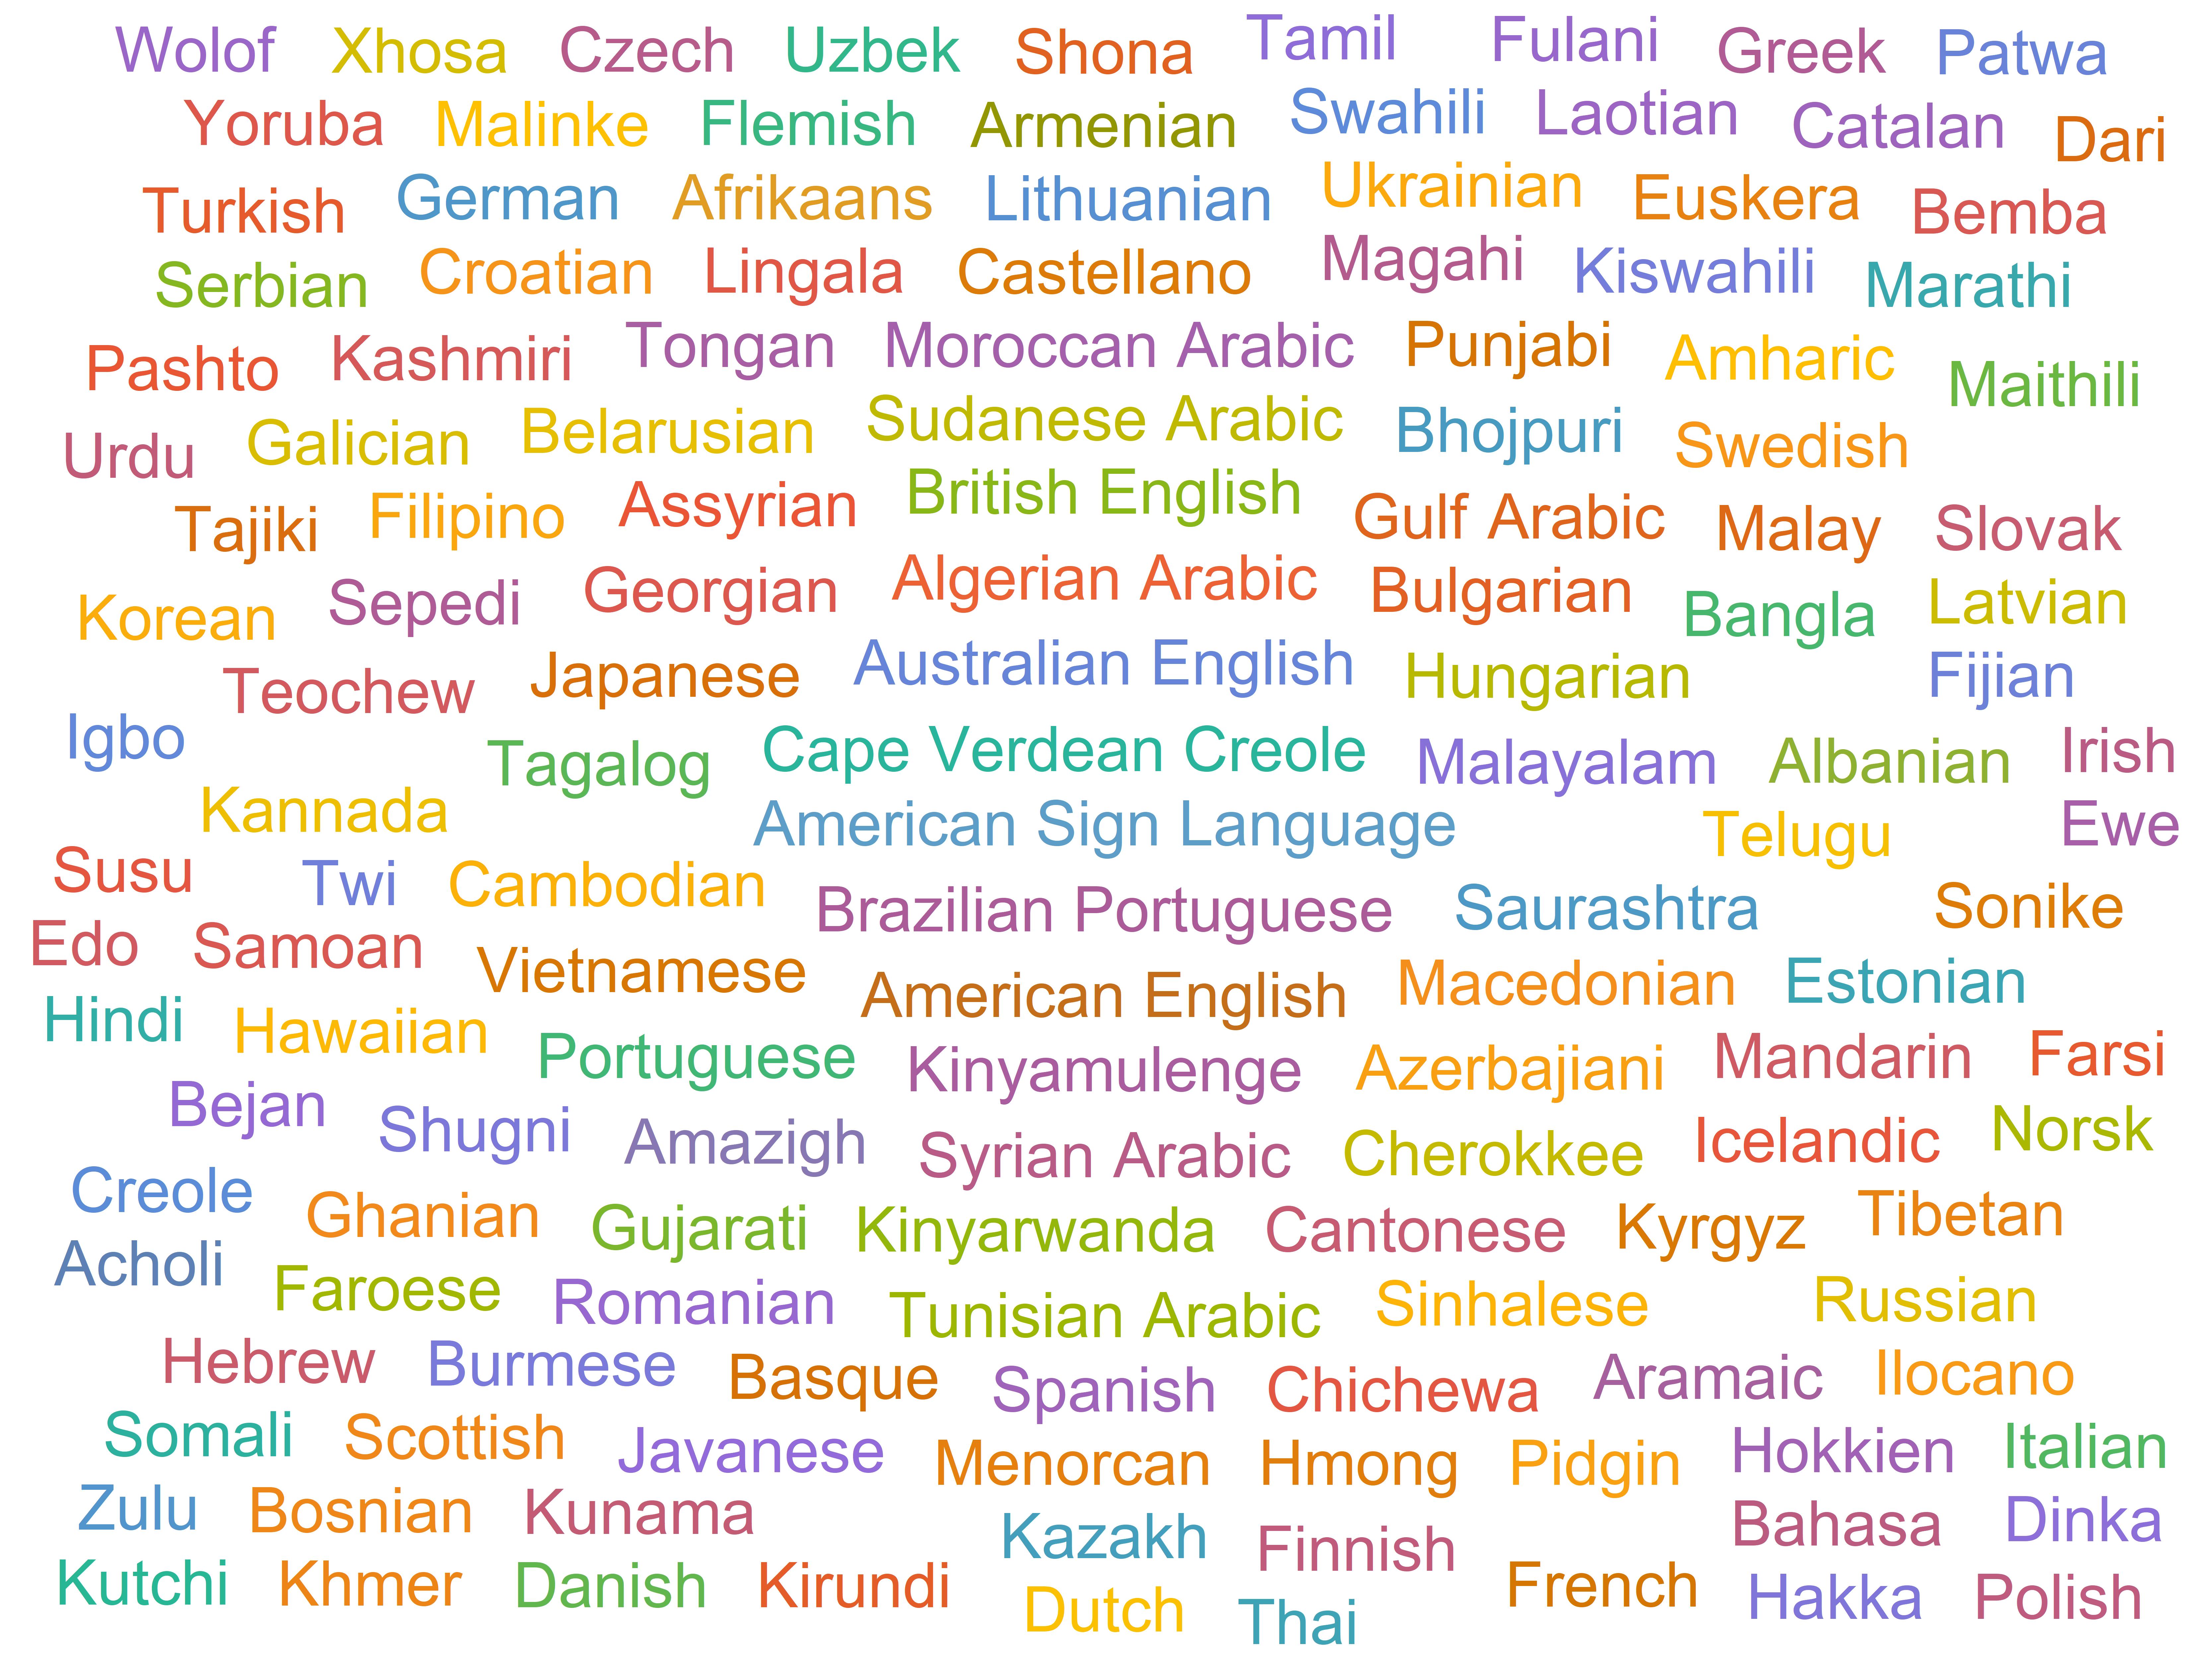
Figure 4. Languages that students on the Out of Eden Learn platform report they speak at home. The languages here are not scaled, meaning the number of students that report the same language does not affect the size of the text.
Another intriguing question relates to the content of student participation—specifically, which curricular activities generate the most engagement? Currently, OOEL offers four Learning Journeys (i.e. curricula): Core Learning Journey 1: The Present and the Local, Core Learning Journey 2: The Past and the Global, Stories of Human Migration, and An Introduction to Planetary Health. Each curriculum is subdivided into various Footsteps, a set of curated activities and online sharing using the OOEL platform. A core component of OOEL’s philosophy and model is the importance of opportunities for young people to engage in meaningful online interactions to complement their offline learning and reflection.
Answering this question proved to be a challenge because we needed to begin with a comparable indicator of dialogue and settled on the number of comments as the indicator. Next, we had to find a way to standardize the entire dataset. To illustrate the problem, Learning Journey 1 has been running since 2014 when OOEL’s platform launched and consequently has far more posts and comments, while Stories of Human Migration launched in 2016 and therefore has fewer posts and comments. As a result, determining how to make meaningful dialogue comparisons between learning journeys became a puzzle.
We sought to solve this problem by defining a measure of Dialogue, where we scaled the total number of comments by the total number of participants in the particular learning journey. In other words, we had an approximate measure of how many comments each student is likely to make during the course of the learning journey. Then, we divided this figure by the scaled dialogue in each learning journey and found the percentage of Dialogue Action. Consider an arbitrary Learning Journey, X:
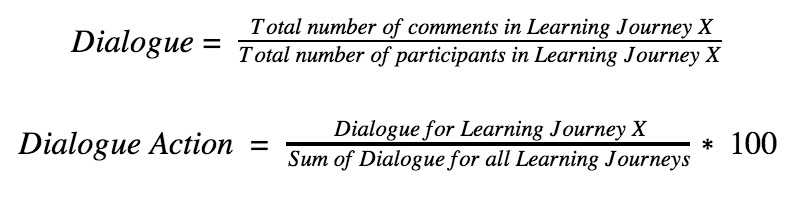
Figure 5. Dialogue Action for each learning journey. According to our metric, Learning Journey 1 received the highest dialogue while Stories of Human Migration received the least dialogue.
As we can see above in Figure 5, Learning Journey 1 has the most Dialogue Action while Stories of Human Migration seems to have the least. At this stage, there is another caveat: we are yet to account for depth to understand the data.
Gauging the depth of student dialogue is easier for an educator with years of experience in both pedagogy and working with students, but a difficult feat for a mindless computer! The OOEL platform currently logs the total number of comments and the comments themselves in response to each student post. It is possible to retrieve the length of each comment from this dataset. Though we understand that comment length is not always going to be an accurate representation of “deep” commenting, we needed to begin with a broad indicator and settled on comment length.
Through this analysis, once we compare learning journeys, it is apparent that Stories of Human Migration (SoHM) has a greater proportion of comments that are longer in terms of word count, despite a relatively low score for Dialogue Action (Figure 6). This made sense because of the structure of the SoHM curriculum, which invites students to share deeply meaningful stories of their own and connect with one another around the topic of human migration. Students are, on average, writing longer comments for posts in the SoHM learning journey.
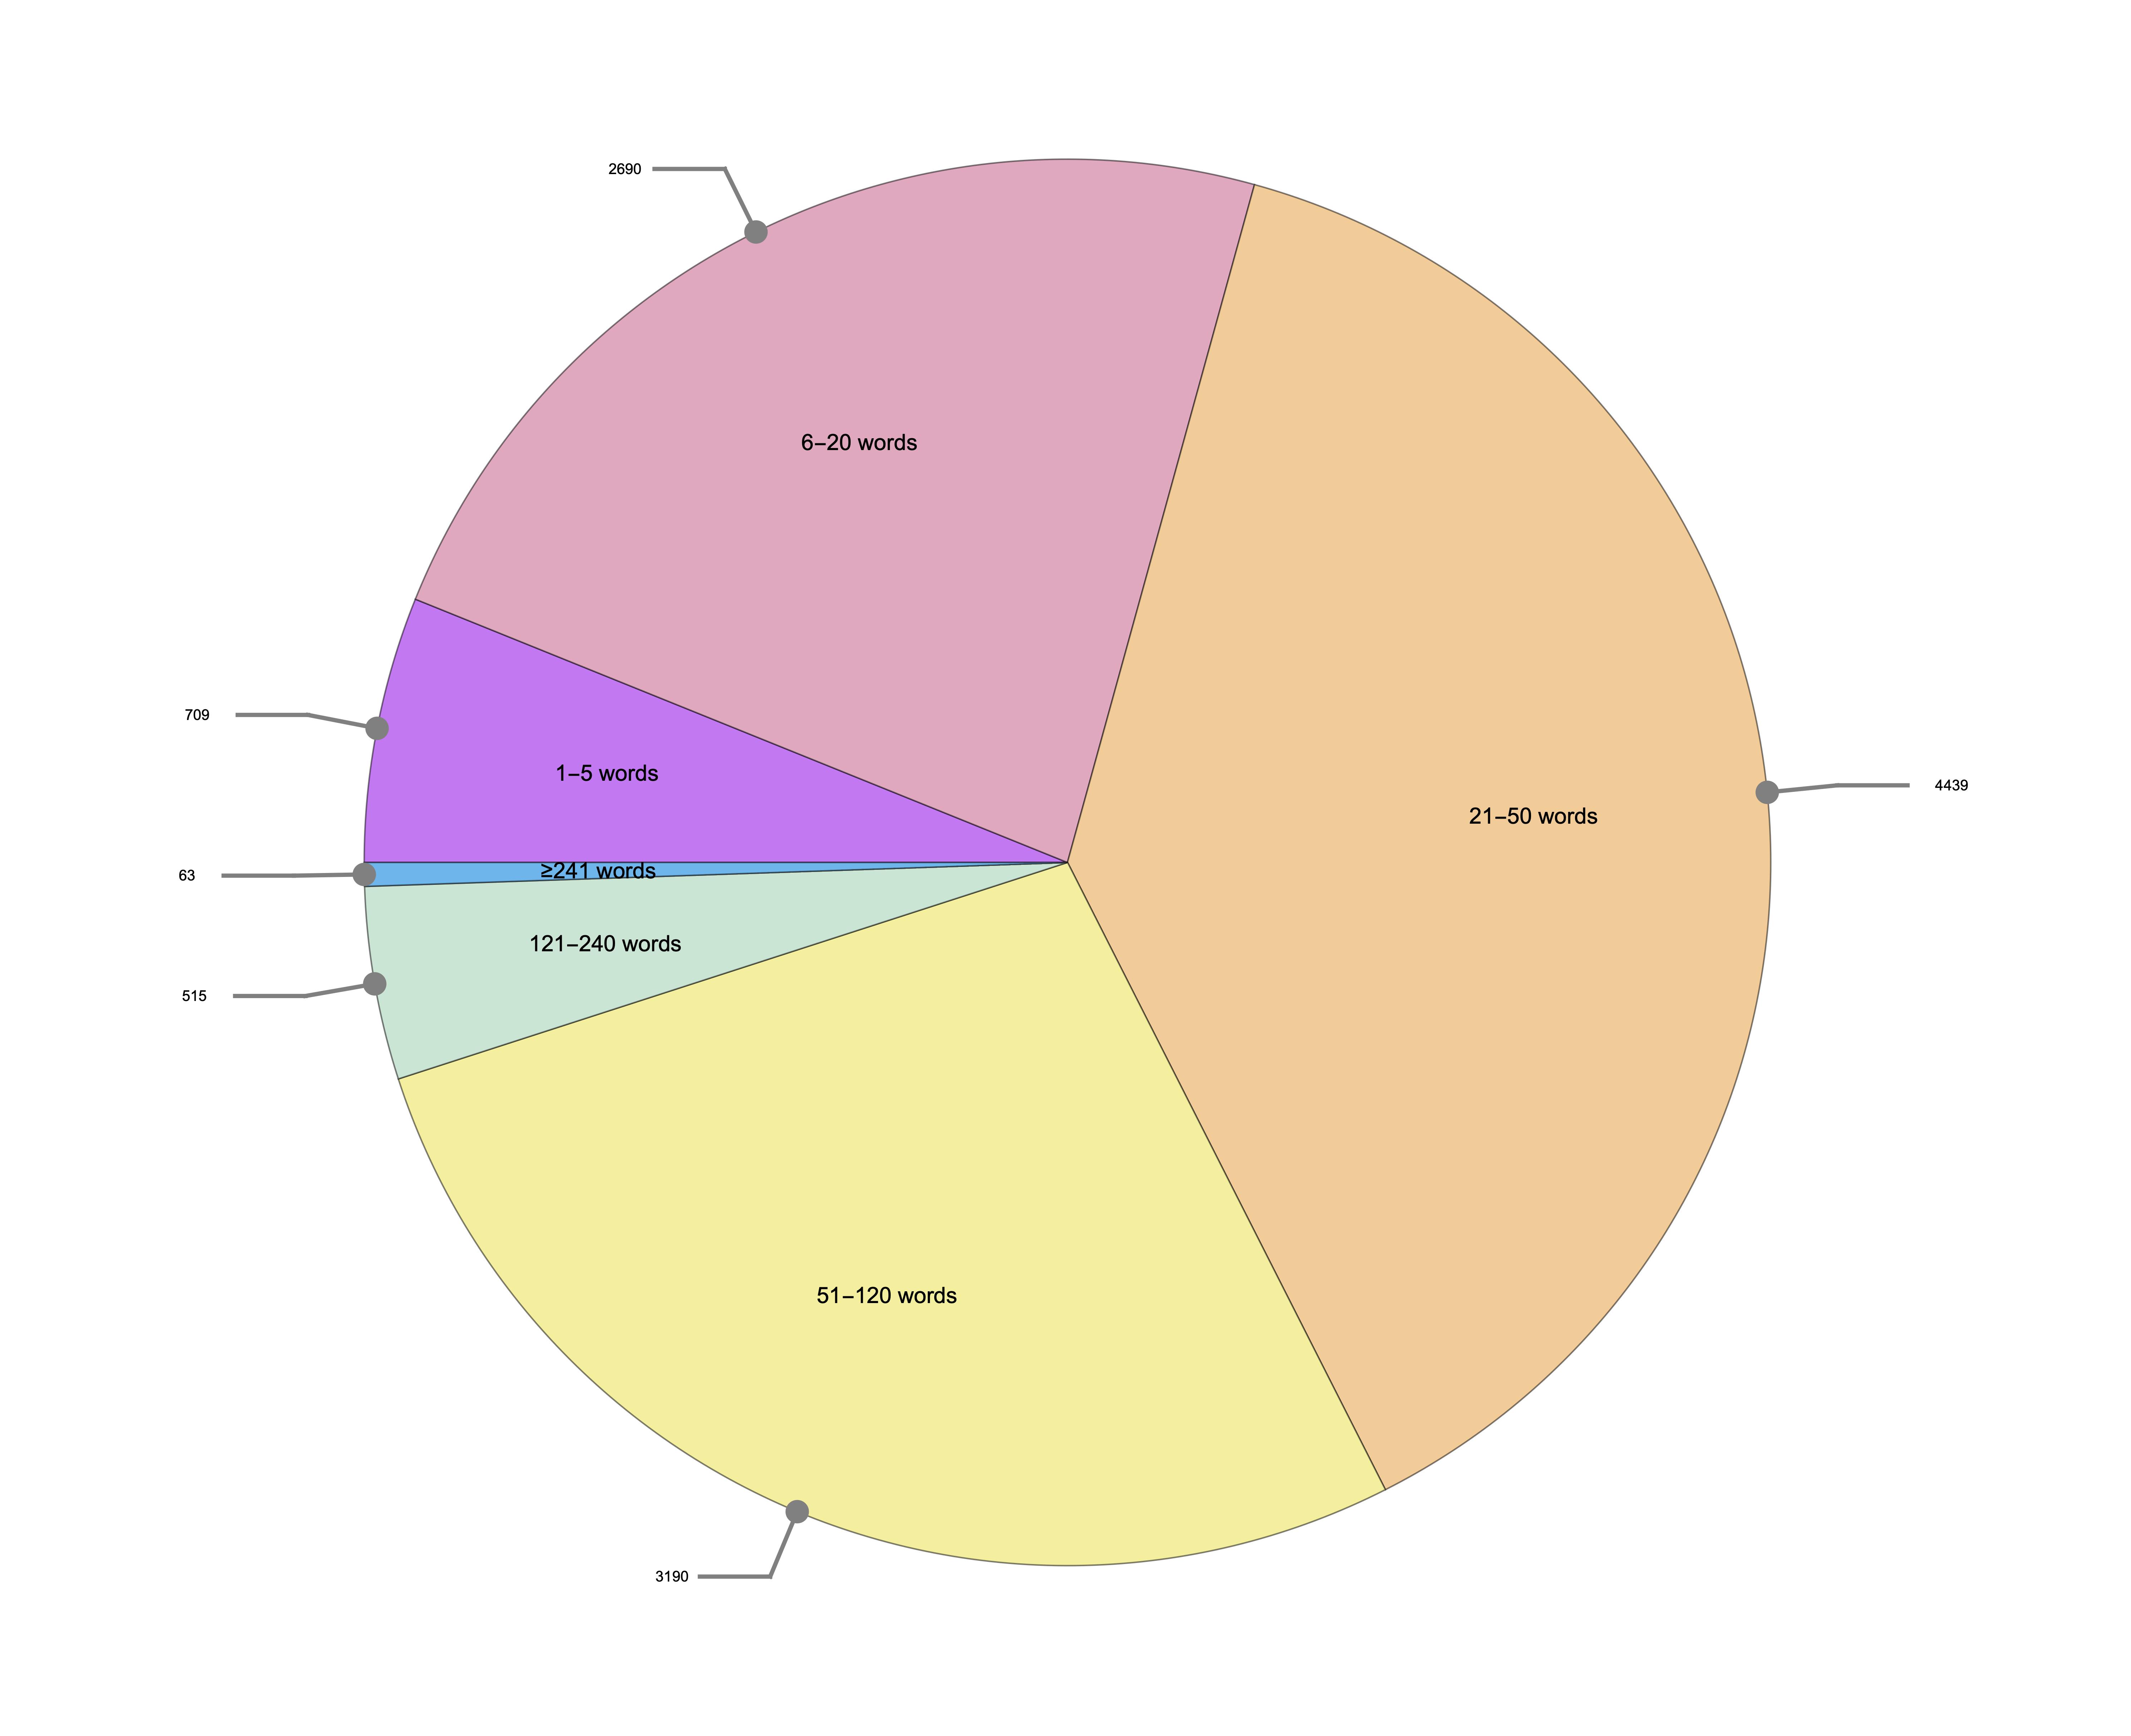
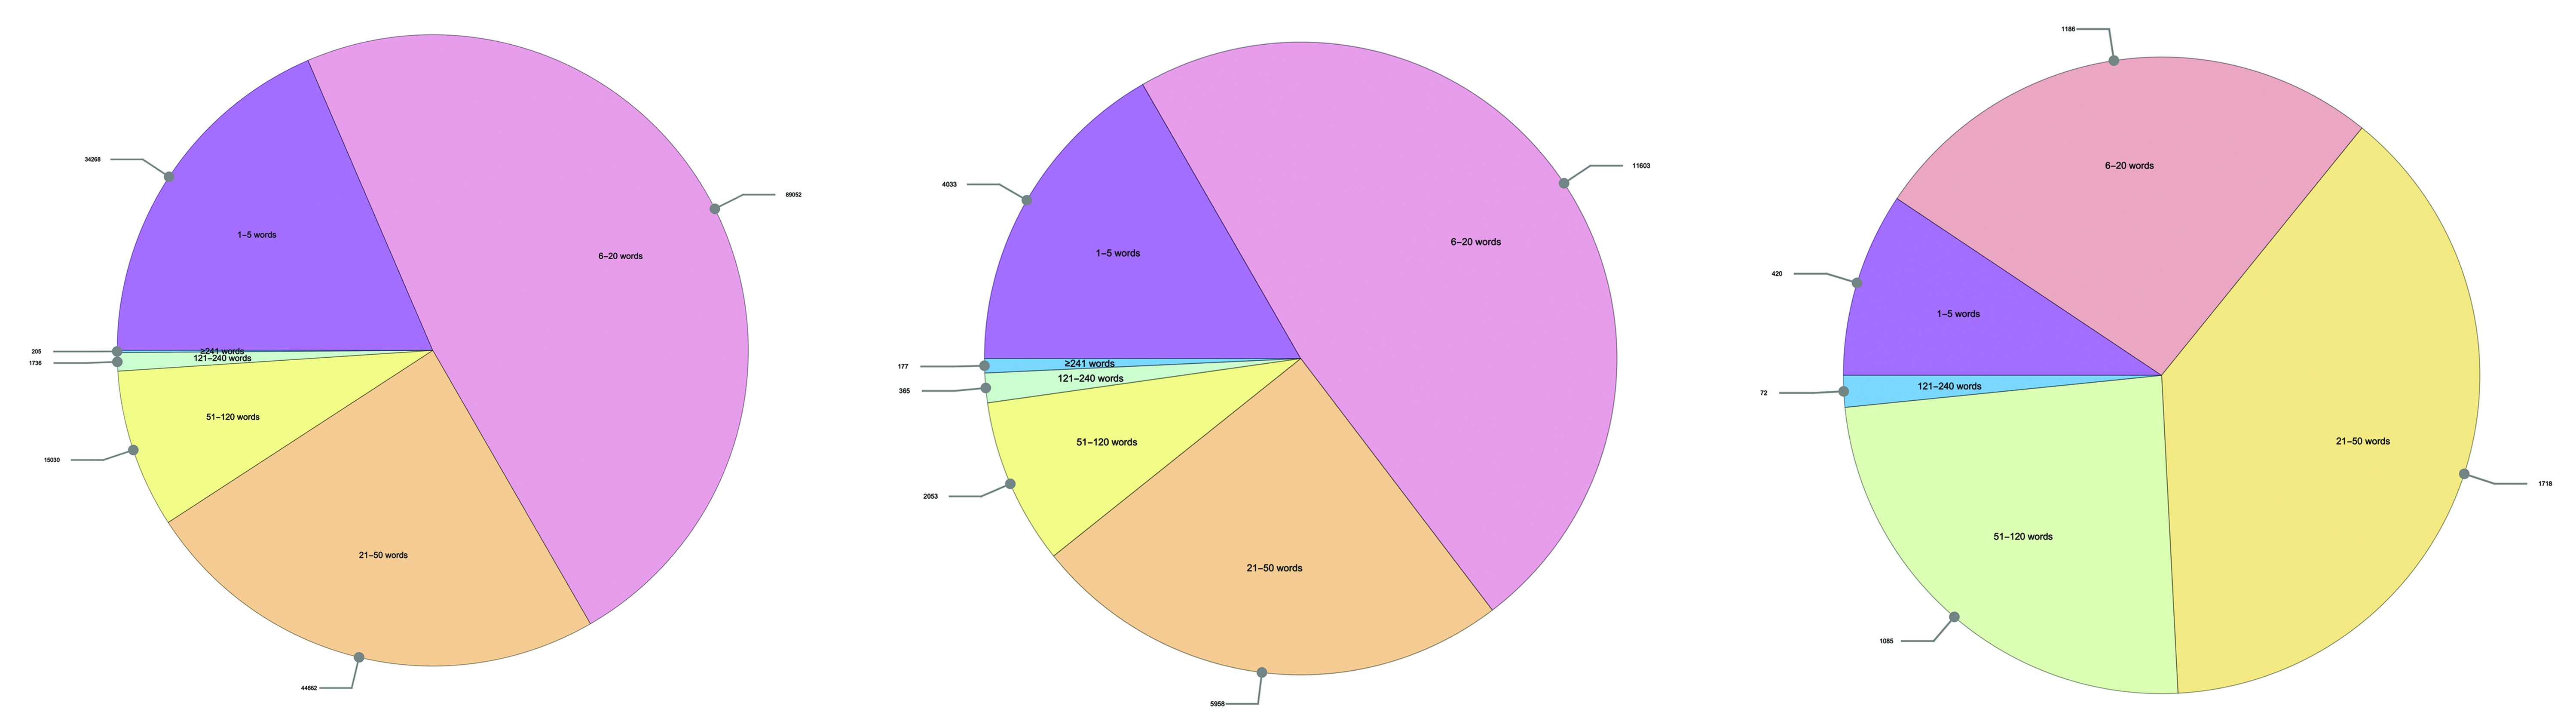
Figure 6. Distribution of comment length in Stories of Human Migration (SoHM), with the number of comments with a specific length as a callout outside each pie. Although Stories of Human Migration had the least dialogue according to our Dialogue Action metric, we noticed that SoHM has the greatest proportion of longer comments (compared to Learning Journey 1, Learning Journey 2, and Planetary Health, as seen above in order from left to right).
During my final week on Out of Eden Learn, I focused on text analysis. Since we are still trying to improve the reliability of our results, I will only discuss my procedure. Researchers at OOEL are interested in the overall emotionality of student comments. In modern machine language terminology, this is a classification task, in which we want to predict the label—or emotion—of a given piece of text. Classification tasks generally involve two major steps: at first, a dataset is fed into the computer with annotated samples (the training set) and an algorithm is trained using this data set to classify a new set (the test set). We usually check the accuracy of the classifier on the test set i.e. how many of the sentences were labeled correctly.
Machine learning is about detecting patterns. The training set in our case was a list of texts with their labeled emotionality. While such analysis is a relatively popular field, there are various competing theories of emotion in psychology and hence, various training sets to choose from. Broadly, these theories involve either labeling discrete emotion labels such as fear, sadness, anger, joy, etc., or characterizing sentiment as a distribution over various polarities (positive, negative, mixed) and intensities (high, medium, low). The OOEL researchers were interested in the former approach of discrete emotions, so I trained a classifier on two different datasets, one containing 4,870 annotated tweets from Twitter and the other trained on selected texts from the Gutenberg Project. Unfortunately, there were too many discrepancies on both classifiers’ results. Presumably, this is because comments on OOEL have a very different pattern compared to tweets from Twitter or texts from novels. So, we began the work of training another classifier on a different OOEL dataset from a prior analysis of dialogue on the OOEL platform, which identified major themes from participant responses. Early results showed promise—for example, we were able to identify a spike in emotion for certain footsteps, such as Documenting the Everyday (Footstep 5 in Learning Journey 1) and Everyday Borders (Footstep 2 in Stories of Human Migration). We hope to continue this work in the future.
During my first week in OOEL, I attended the Vision and Justice Convening, a conference at the Harvard Radcliffe Institute on the intersection of art, race, and justice. When asked about the role of machines in predicting the trajectory of someone’s life, lawyer and activist Bryan Stevenson shared an anecdote of someone with a history of childhood abuse and multiple offences, who nevertheless went on to lead a very productive life with a happy family—an unexpected outcome compared to what crunching numbers would have us believe. Stevenson further expanded that it is imperative for data collectors and analysts to be mindful of their own biases and to have compassion for the subjects whom they are researching. My experience on Out of Eden Learn has reinforced this view, showing me how educational analytics are useful insofar as we collect student data in a thoughtful and responsible manner and we carefully consider the kinds of questions we ask.